
At the crux of efficient supply chain management lies the challenge of balancing the supply and demand for inventory. To manage inventory successfully it is crucial to accurately predict and forecast the demand for the product. It is done by combining historical purchasing data with the buying trends of the consumer to predict the future sales flow. In order to achieve a high level of accuracy, inventory forecasting is done based on the clustering of stock keep units (SKUs). When items are clustered they are distinguished based on the resemblance in their sales forecasts and a common estimate is at that point computed for each cluster.
What is the problem with Forecasting?
One of the major hurdles which many organizations face is the accuracy in demand forecasting. An inaccurate forecast can lead to stocking up excess inventory and loss in sales. Typically, in an organization, there can be more than 10,000 SKU and if you are applying the same algorithm to all these SKUs, then the forecast can be very inaccurate. In addition to that, there are no insights about the pattern or characteristics of SKU which could have been used by demand planners to make better strategic decisions.
Why Traditional Forecasting Tools Fail?
There are 3 main reasons as to why traditional forecasting tools may not be useful:
- Most statistical forecasting software tools rely entirely on historical data. This is problematic as it could lead to overfitting and selection of an in-appropriate forecasting algorithm, which would give a highly inaccurate forecast.
- Other forecasting tools use techniques that hold out some portion of data and based upon best fit, select the best method. But even this method has many drawbacks. For instance, a poor method could get picked due to underlying conditions and get fitted into the training dataset, which could lead to disaster forecasts for the future.
- More often than not, there is a problem of consistency with traditional forecasting tools. For the same data, the forecasting method could differ over two successive runs with negligible data changes.
Therefore ai in forecasting is revolutionizing the current processes.
Successful forecasting using ai includes below methods:
Clustering Based Forecasting
Here we are clustering SKU based on the historical sales pattern such as trend, seasonality, and cyclicity using the unsupervised learning algorithm. As for different clusters, we use various mathematically advanced linear-forecasting models that will be deemed appropriate for that cluster.
Feature Engineering for time series forecasting
Several cases where traditional forecasting algorithms fail Supervised Learning Models are preferably used and that’s where feature engineering for time series comes to the fore. Feature Engineering in layman terms refers to the derivation of the new variables from the time series data. It has the potential to transform your time series model from just an adequate model to a robust forecasting model.
Feature Engineering can be broadly classified into 6 categories
- Date Features
- Rolling Features
- Expanding Features
- Lagged Features
- Time-Related Features
- Domain-specific Features
Advantage of Machine Learning based forecasting over time series algorithm
- Can capture both linear and nonlinear relationship
- Identifies the variables that are useful for prediction
- Not susceptible to outliers in the data
- Has High Accuracy
- Works for both univariate and multivariate forecasting
Forecasting using Multi-Variate Time Series Data:
What is Multi-Variate Forecasting?
A multivariate time series forecasting not only involves an analysis of the past values but also other dependent variables which are important to predict future values. Majority of the retail and manufacturing businesses have to consider several factors while forecasting. In fact, in the real scenario, the majority of the businesses have to do multivariate forecasting. For instance, sales of a retail store depend on holiday, promotion, discounts, etc, whereas sales of a manufacturing firm may depend upon price, on-hand inventory of the retailer, etc.
Problem with Multi-Variate Forecasting:
Traditional Forecasting Systems cannot quantify all these varied factors for forecasting and hence we need advanced Mathematical Forecasting Techniques for accurate prediction. Several intricate calculations have to be done before multivariate forecasting like Correlation, Lagged Correlation, Price Elasticity, drivers analysis, cumulative lift due to these drivers, etc. All these factors and calculations make Multi-Variate analysis and forecasting extremely difficult.
Road Map for Multivariate Forecasting:
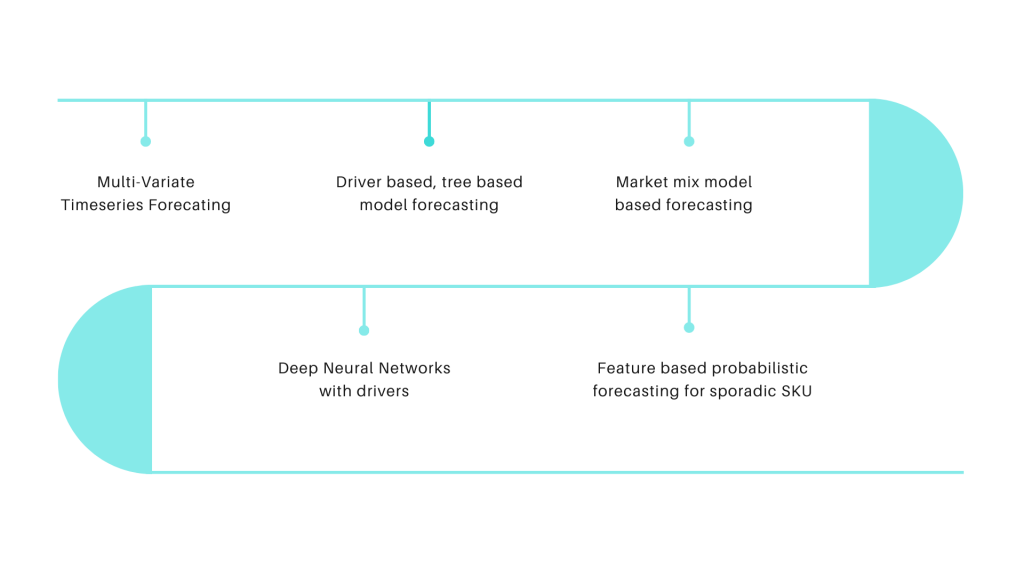
Above is a roadmap of various multivariate forecasting models we deployed for prediction. We first started with the advanced Linear Mathematical model and then transitioned towards Market Mix Model-Based Forecasting and finally moved towards Machine Learning and Deep Learning-based forecasting techniques.
Forecasting for sporadic SKUs
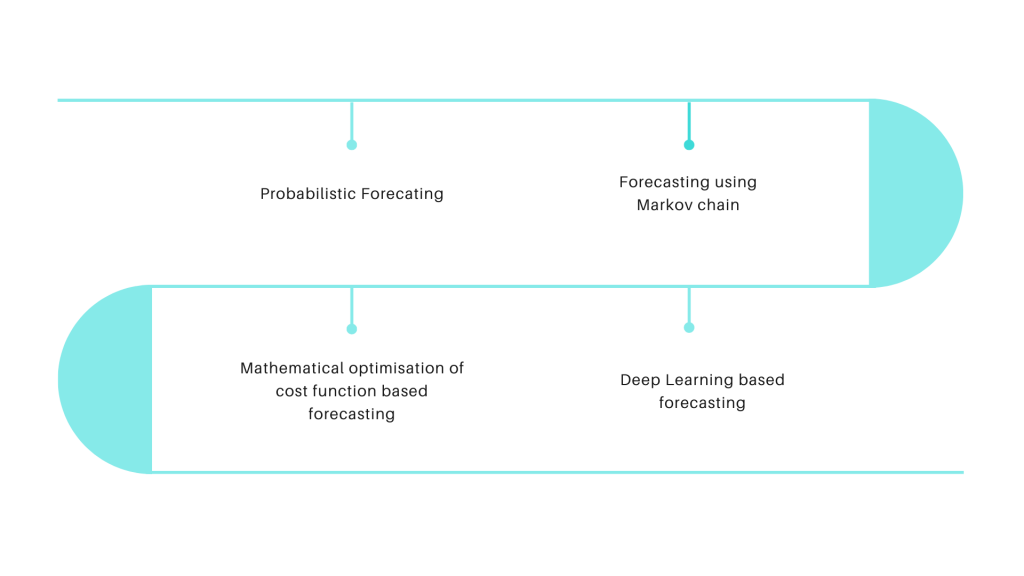
Few products are fast-moving and others are relatively slow-moving. Forecasting sales for a slow-moving Stock Keeping Unit is quite difficult. The problem is further aggravated if the SKU’s have a lower shelf life (perishable goods like fruits and vegetables) and are slow-moving (goods that serve a niche segment of customers or are bought occasionally). The above figure shows the forecasting roadmap using machine learning for sporadic SKUs.
Hierarchal Forecasting

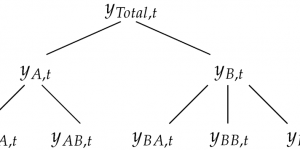
What is Hierarchical Forecasting?
Hierarchical time series forecasting is the process of generating forecasts which are coherent in nature, allowing individual time series to be forecasted individually while still preserving its characteristics and relationship within the hierarchy. Some of the common hierarchies include:
- Geographical Hierarchies
- Product Hierarchies
- Period Hierarchies
When to use Hierarchical Forecasting?
Hierarchical time series often arise due to geographic divisions and product hierarchy. The challenge is that we require forecasts that are coherent across the aggregation structure. In other words, we require forecasts to add up in a manner that is consistent with the aggregation structure of the collection of time series. Below are several methods and techniques for producing coherent forecasts in terms of hierarchical time series:
Hierarchical Time Series Forecasting Techniques:
1) Bottom-Up Approach: – In bottom-up forecasting we forecast at the most granular level and then we aggregate up to forecast for the higher level.
Advantage: – Good Forecast at the bottom level
Disadvantage: – Bad Forecast at a higher level
2) Top-Down Approach: – In the top-down approach, we first forecast at the highest level of the hierarchy, then split up the forecasts to get estimates for the granular levels, typically using historical proportions.
Advantage: – Good Forecast at Higher Level
Disadvantage: – Bad Forecast at bottom Level
3) Middle Ground Approach: – This approach starts by forecasting the middle level, neither the most granular nor the most aggregated. After these numbers are calculated, the higher levels in the hierarchy are then forecasted using the bottom-up approach and the lower levels with the top-down approach.
Advantage: – Good Forecast at both Higher and bottom Level
Disadvantage: – Computationally quite expensive
The bottom line is that hierarchical time series forecasting is a highly useful group of techniques which helps to ensure consistency in planning, as well as making sure that forecasts at all different levels and parts of the business match up.
Stay tuned for our next blog article.
Get in touch with IT Action Group today.
Kelber, J. (n.d.). The Top Challenges in Supply Chain Forecasting. Retrieved September 18, 2020, from https://blog.flexis.com/top-challenges-supply-chain-forecasting
Dar, P., Singh, A., Choudhary, A., & Sharma, P. (2018, September 27). September 2018. Retrieved September 18, 2020, from https://www.analyticsvidhya.com/blog/2018/09/
Forecasting: Principles and Practice. (n.d.). Retrieved September 18, 2020, from https://otexts.com/fpp2/hts.html
Towards Data Science. (n.d.). Retrieved September 18, 2020, from https://towardsdatascience.com/